
Accept-all (catch-all) and unknown are not the same as valid. They mean the check could not prove the mailbox is real — treat...

Key Takeaways
Every email marketer checks the unsubscribe rate after a campaign. Without a clear benchmark, each opt-out can feel like a failure, but most of the time, it isn’t. A healthy email unsubscribe rate is normal, expected, and in some cases, a sign that your list is doing exactly what it should: filtering itself to the people who genuinely want to hear from you.
For opt-in marketing lists, unsubscribe rates below 0.5% per campaign are generally considered healthy, while rates under 0.2% often point to strong list quality and relevant content. Understanding what drives the rate helps determine when it signals a problem.
A healthy email unsubscribe rate is generally below 0.5% per campaign for an opted-in marketing list, but this number only becomes meaningful when you interpret it in context.
A single campaign with a higher-than-usual unsubscribe rate often means that one email missed the mark. The content may not have been relevant to that segment, the subject line may have attracted the wrong audience, or the timing may have been off. That’s worth reviewing, but not a crisis. A slow, consistent rise in unsubscribe rate across three, four, or five consecutive campaigns is a different signal. It usually points to declining list quality, sending too frequently, or content that no longer matches subscriber expectations.
Benchmark comparisons become less reliable with small audiences because a handful of unsubscribes can noticeably change the percentage. For example, one unsubscribe from a list of 400 equals a 0.25% unsubscribe rate. On smaller lists, focus on trends across multiple campaigns rather than judging performance from a single send.
In July 2025, Gmail introduced Manage subscriptions, a feature that lets users view and unsubscribe from mailing lists from a single screen. As the rollout expanded, some senders saw modest increases in unsubscribe rates simply because leaving a list became easier. A noticeable bump during that period, particularly among Gmail-heavy audiences, does not necessarily indicate declining content quality or list health. It may simply be Gmail making it easier for low-engagement subscribers to act on what they already felt.
The 0.5% threshold is a useful rule of thumb, but average unsubscribe rates vary by industry, audience, and campaign type.
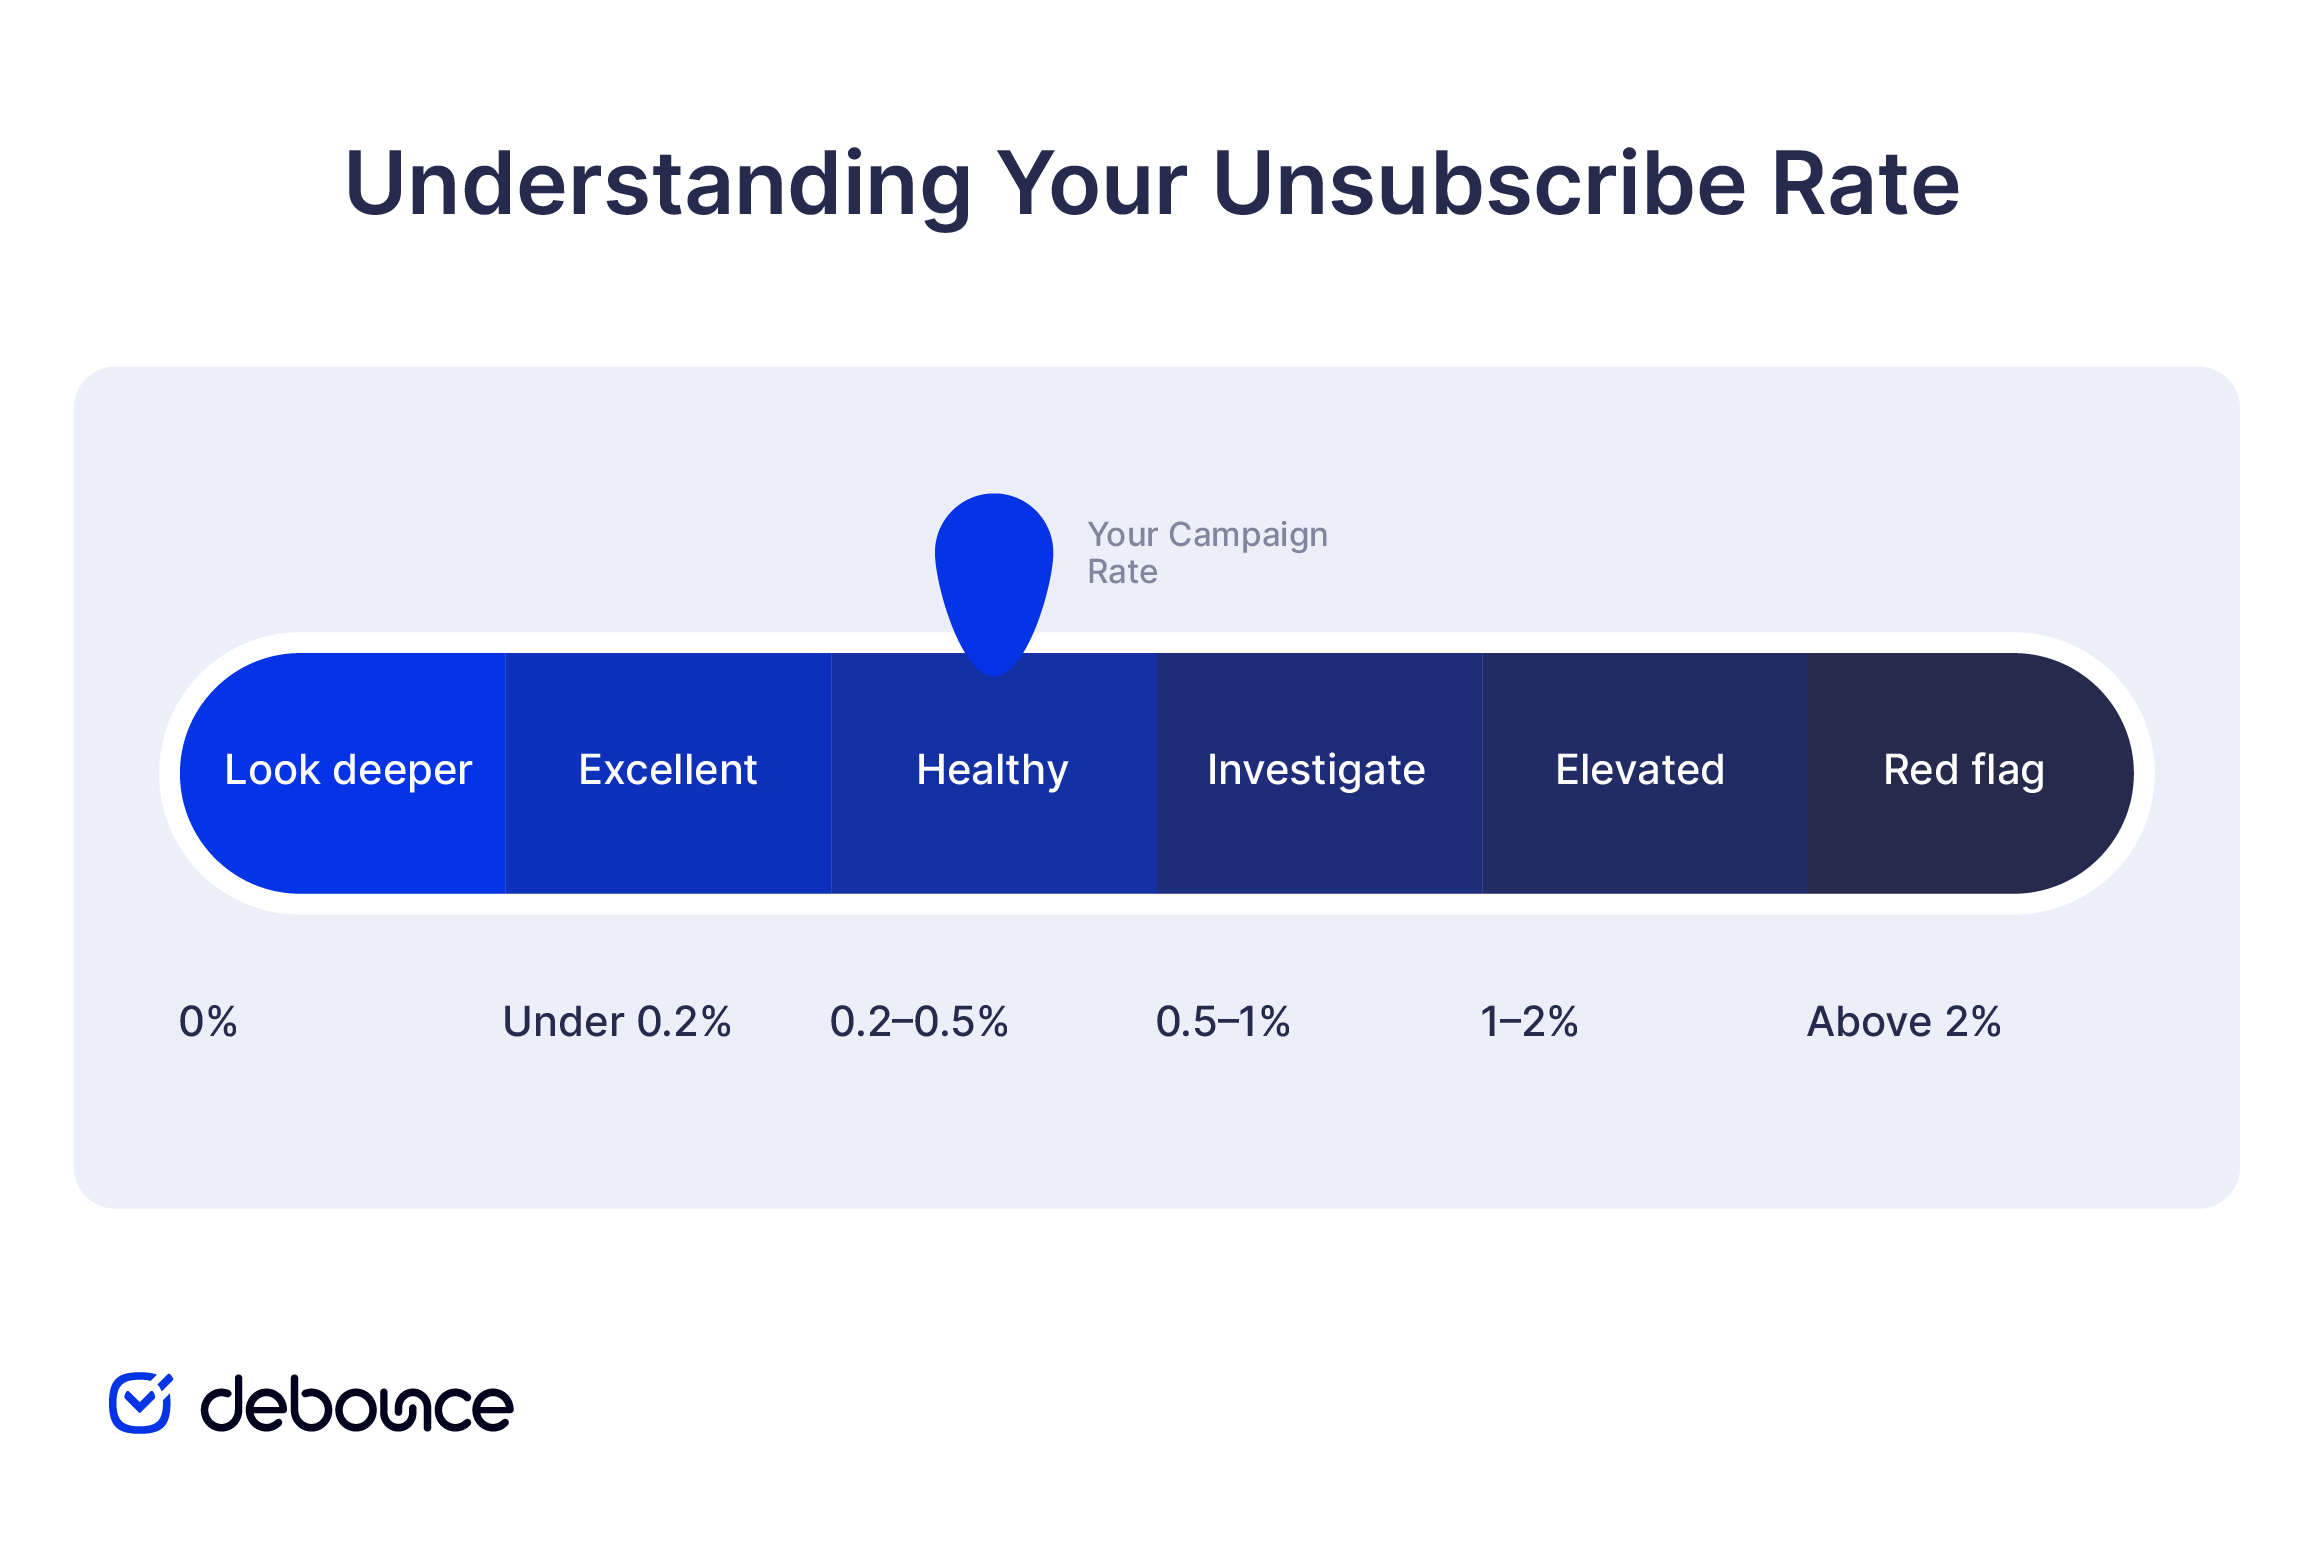
0%: Look beyond the unsubscribe rate
A campaign with no unsubscribes is not automatically a concern, particularly when the audience is small. However, a consistent 0% rate should not be treated as proof of perfect content fit. Many disengaged subscribers simply stop opening or clicking rather than formally opting out. Review the unsubscribe rate alongside clicks, conversions, and other engagement trends before drawing conclusions.
Under 0.2%: Excellent
This is well below the 0.5% benchmark. It generally suggests that the audience, content, and sending frequency remain well-matched. However, list quality cannot be judged from unsubscribes alone.
0.2–0.5%: Healthy
This is a reasonable range for most opted-in marketing lists. A stable rate within this band usually requires no immediate action, although performance should still be compared with previous campaigns and the relevant industry benchmark.
0.5–1%: Investigation zone
A single campaign in this range is not necessarily a crisis, but repeated results need a closer look. Check whether the subject matter still matches what subscribers signed up for, whether sending frequency has changed, and whether one segment or acquisition source is producing most of the opt-outs.
1–2%: Elevated
For an established opt-in list, repeated results in this range suggest that too many subscribers no longer find the emails relevant or expected. Review content topics, sending frequency, audience targeting, and the sources bringing people onto the list. Pay particular attention to whether one segment, campaign type, or signup channel is responsible for most of the unsubscribes.
Above 2%: Red flag
A single unusual campaign may have an identifiable cause, but a sustained rate above 2% requires immediate attention. Review where subscribers came from, what they were promised at signup, how recently they joined, and whether certain campaigns or segments account for most of the loss. Continued high unsubscribe rates may also weaken sender reputation.
A good unsubscribe rate depends on your industry. Cross-industry averages are a starting point, but the audience characteristics, content frequency, and subscriber expectations vary enough between sectors. A SaaS newsletter should therefore be compared with similar SaaS campaigns rather than a retail list built around frequent promotions.
Industry benchmarks also assume the list is opted-in and recently validated. Stale or unverified lists distort the wider performance picture because invalid addresses generate bounces, while inactive subscribers may remain on the list without opening, clicking, or unsubscribing. This can make the unsubscribe rate appear healthier than the list actually is, even as engagement and deliverability decline. DeBounce email validation helps remove invalid and undeliverable addresses before you compare campaign performance with an industry benchmark.
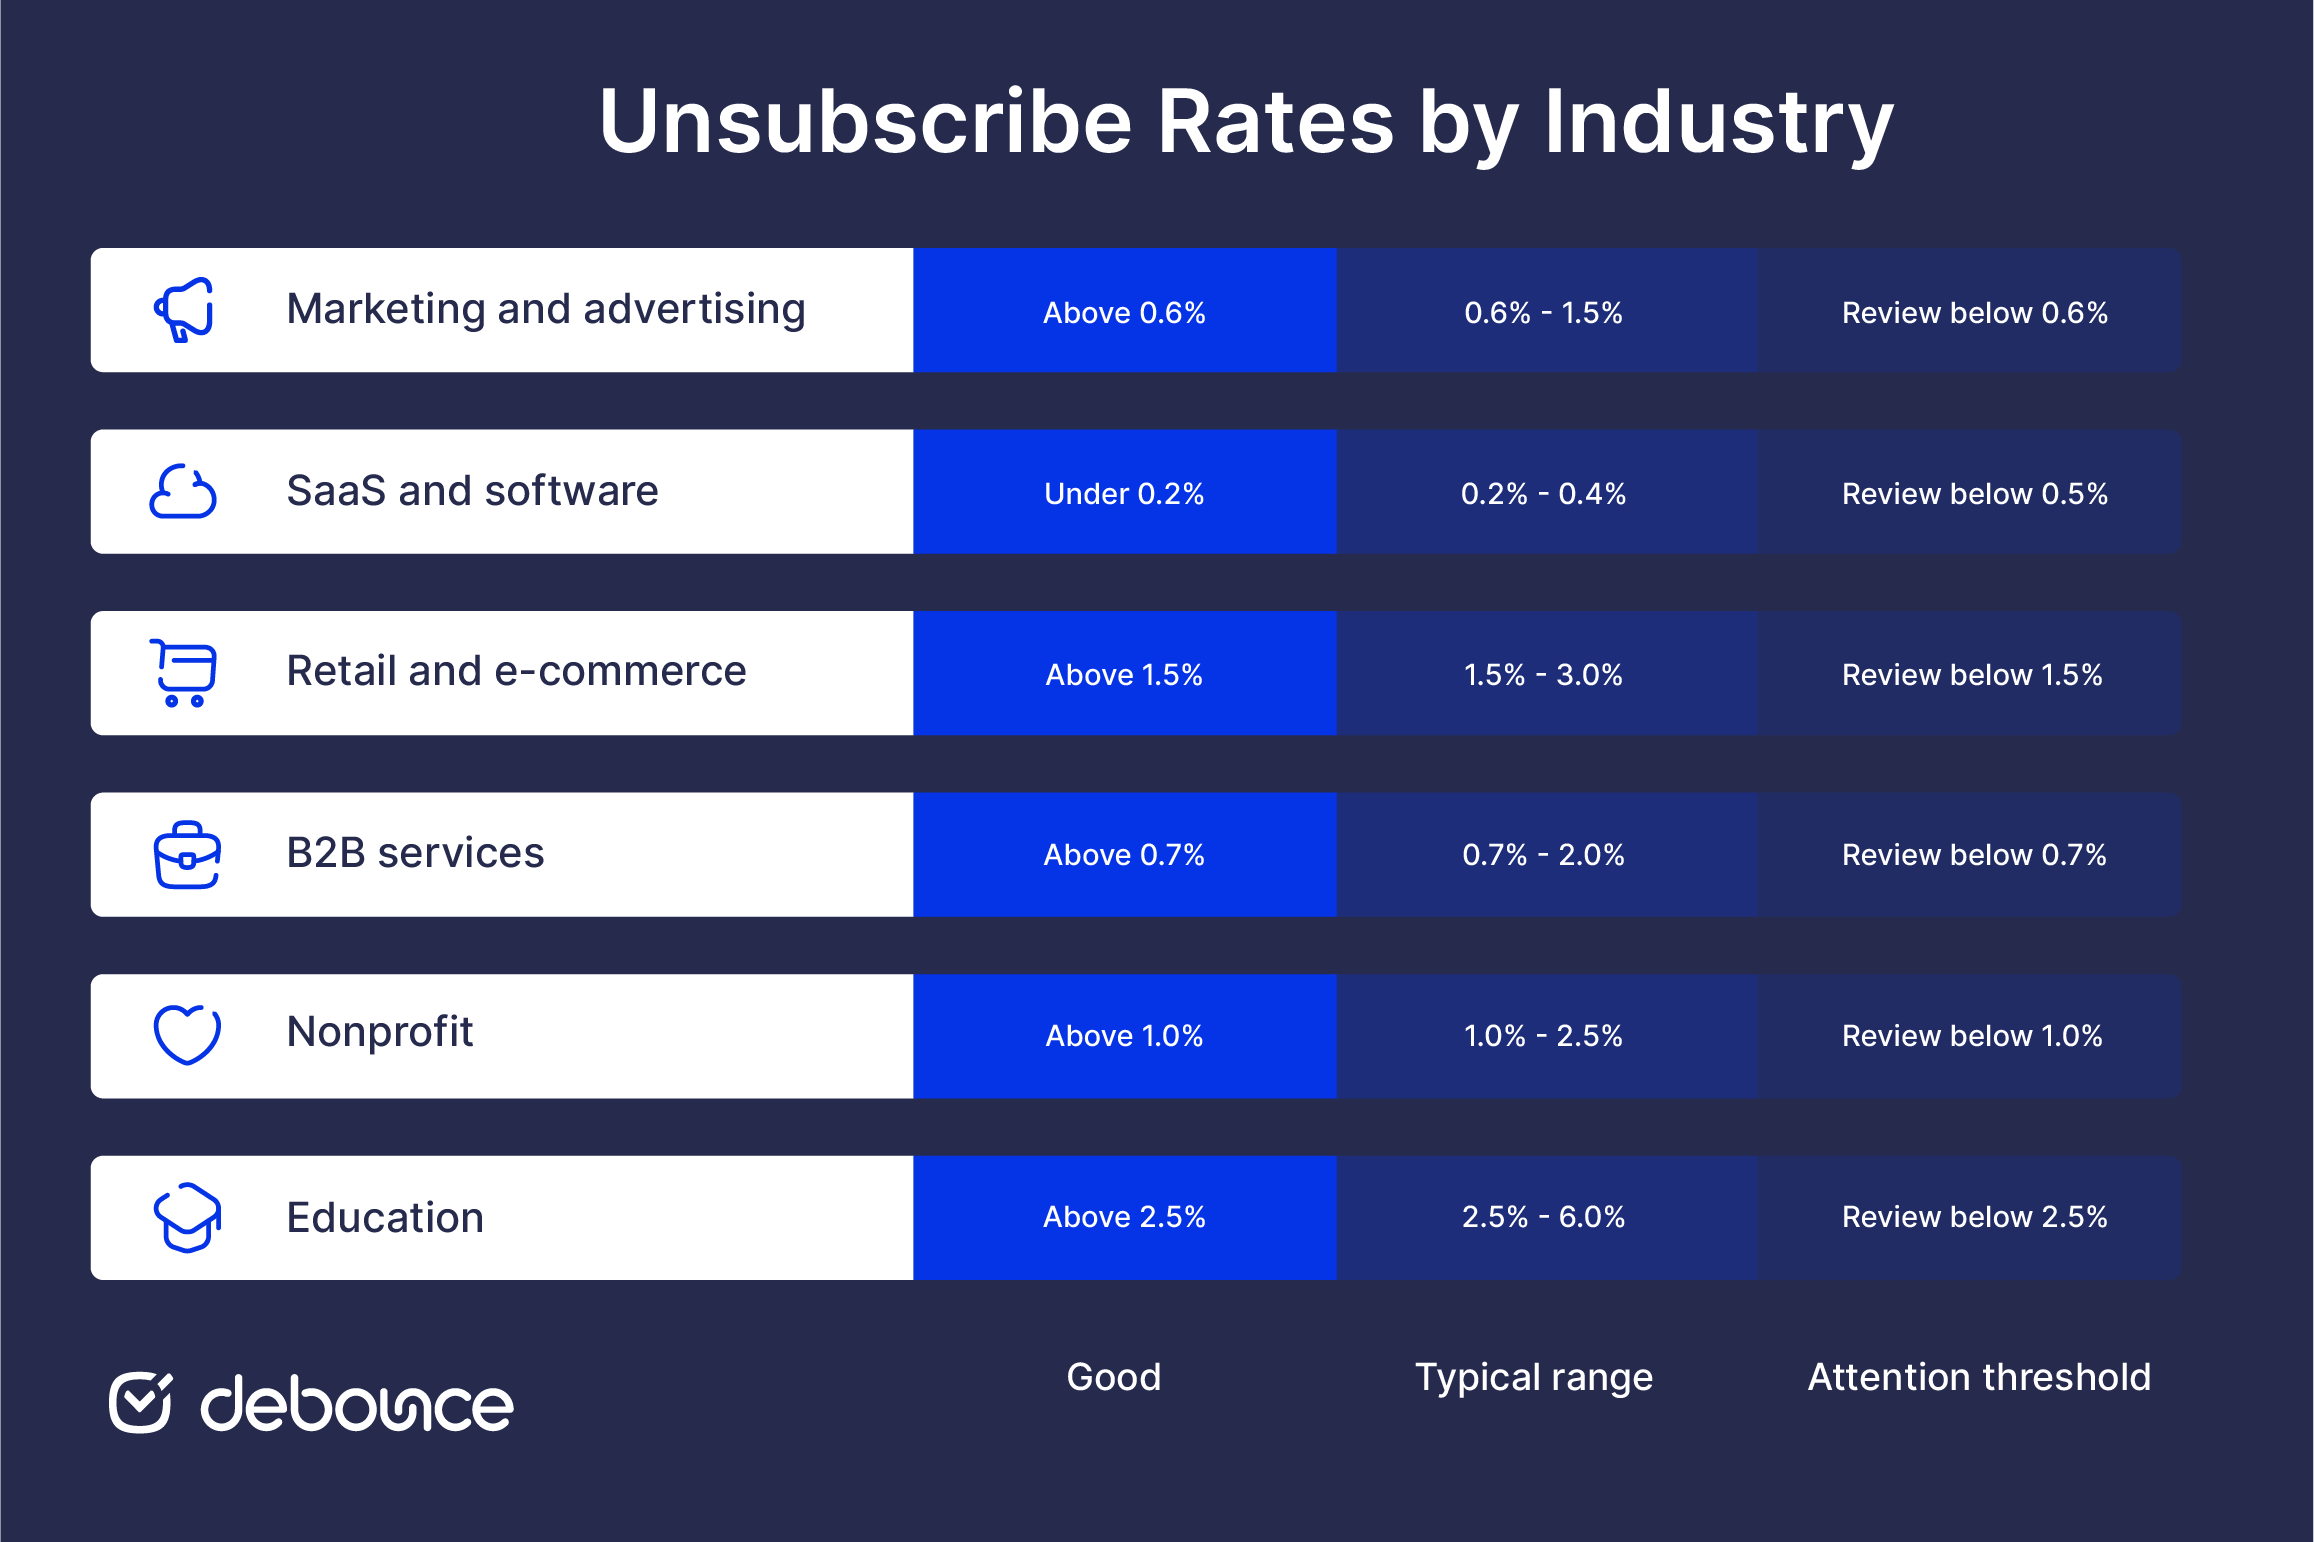
Benchmark numbers: Average around 0.3–0.5%; good is under 0.3%; above 0.7% warrants attention.
Why this baseline: Marketing and advertising emails are often promotional and sent more frequently than editorial newsletters, which may lead to slightly higher opt-out rates. Unsubscribes also rise when the offers or topics no longer match what subscribers expected when they joined.
Industry-specific nuance: Agencies frequently inherit client lists built through several acquisition channels. A spike after taking over a new list may therefore reflect poor signup quality, outdated contacts, or unclear expectations, not content quality.
Benchmark numbers: Average around 0.2–0.4%; good is under 0.2%; above 0.5% warrants review.
Why this baseline: SaaS audiences often subscribe for a specific reason, such as onboarding support, product updates, or feature announcements. They are more likely to opt out when emails become too promotional, arrive too often, or move away from the product and use cases that originally interested them.
Industry-specific nuance: Trial-to-paid conversion sequences can spike unsubscribe rates temporarily as free-trial users who didn’t convert clean themselves off the list. This is not necessarily a content failure, but it should be measured separately from communication sent to active customers and paying users.
Benchmark numbers: Average around 0.4–0.6%; good is under 0.4%; above 0.8% warrants attention.
Why this baseline: Retail lists often include subscribers who joined to receive a one-time discount, early access, or a specific offer, giving them less long-term interest than subscribers to editorial or product-focused emails. Retailers also tend to send more frequently, especially during promotional periods, which can increase opt-outs.
Industry-specific nuance: Unsubscribe rates often rise after Black Friday, holiday sales, and other peak shopping periods as deal-driven subscribers leave once the promotion ends. A temporary increase followed by a return to the usual range is likely seasonal.
Benchmark numbers: Average around 0.2–0.3%; good is under 0.2%; above 0.5% signals drift.
Why this baseline: B2B subscribers usually join a list to address a specific professional need, evaluate a service, or follow developments relevant to their role. They may tolerate regular emails when the content is useful, but they are quick to opt out when messages feel too broad, repetitive, or poorly matched to their stage in the buying process. Lists tend to be smaller and more carefully curated.
Industry-specific nuance: Changes in job title, company, or responsibilities can make previously relevant contacts less suitable over time. Periodic re-engagement campaigns, preference updates, and list validation help identify contacts whose needs have changed and keep unsubscribe data more representative of the active audience.
Benchmark numbers: Average around 0.2–0.4%; good is under 0.2%; above 0.5% warrants review.
Why this baseline: Nonprofit subscribers often join because they already feel connected to the cause, which can support lower unsubscribe rates than more promotional sectors. Rates may rise when appeals become too frequent, messages feel repetitive, or the content focuses too heavily on donations without providing meaningful updates.
Industry-specific nuance: Year-end fundraising campaigns may produce a temporary increase in opt-outs as inbox volume rises and donors reassess which organizations they want to hear from. Segmenting contacts by donation history and campaign participation helps separate expected seasonal turnover from a broader relevance or frequency problem.
Benchmark numbers: Average around 0.2–0.4%; good is under 0.2%; above 0.5% is worth investigating.
Why this baseline: Education lists often include prospective students, current students, parents, alumni, and faculty, each with different information needs. Sending the same messages to every group increases the risk of irrelevant content and unnecessary opt-outs. Clear segmentation helps keep communication aligned with each audience.
Industry-specific nuance: Unsubscribe rates may rise around graduation, enrollment, and the start of a new academic year as subscribers move into a different stage of their relationship with the institution.
Keeping unsubscribe rates low starts with preventing the conditions that make subscribers leave. These five steps help maintain relevance and set clear expectations.
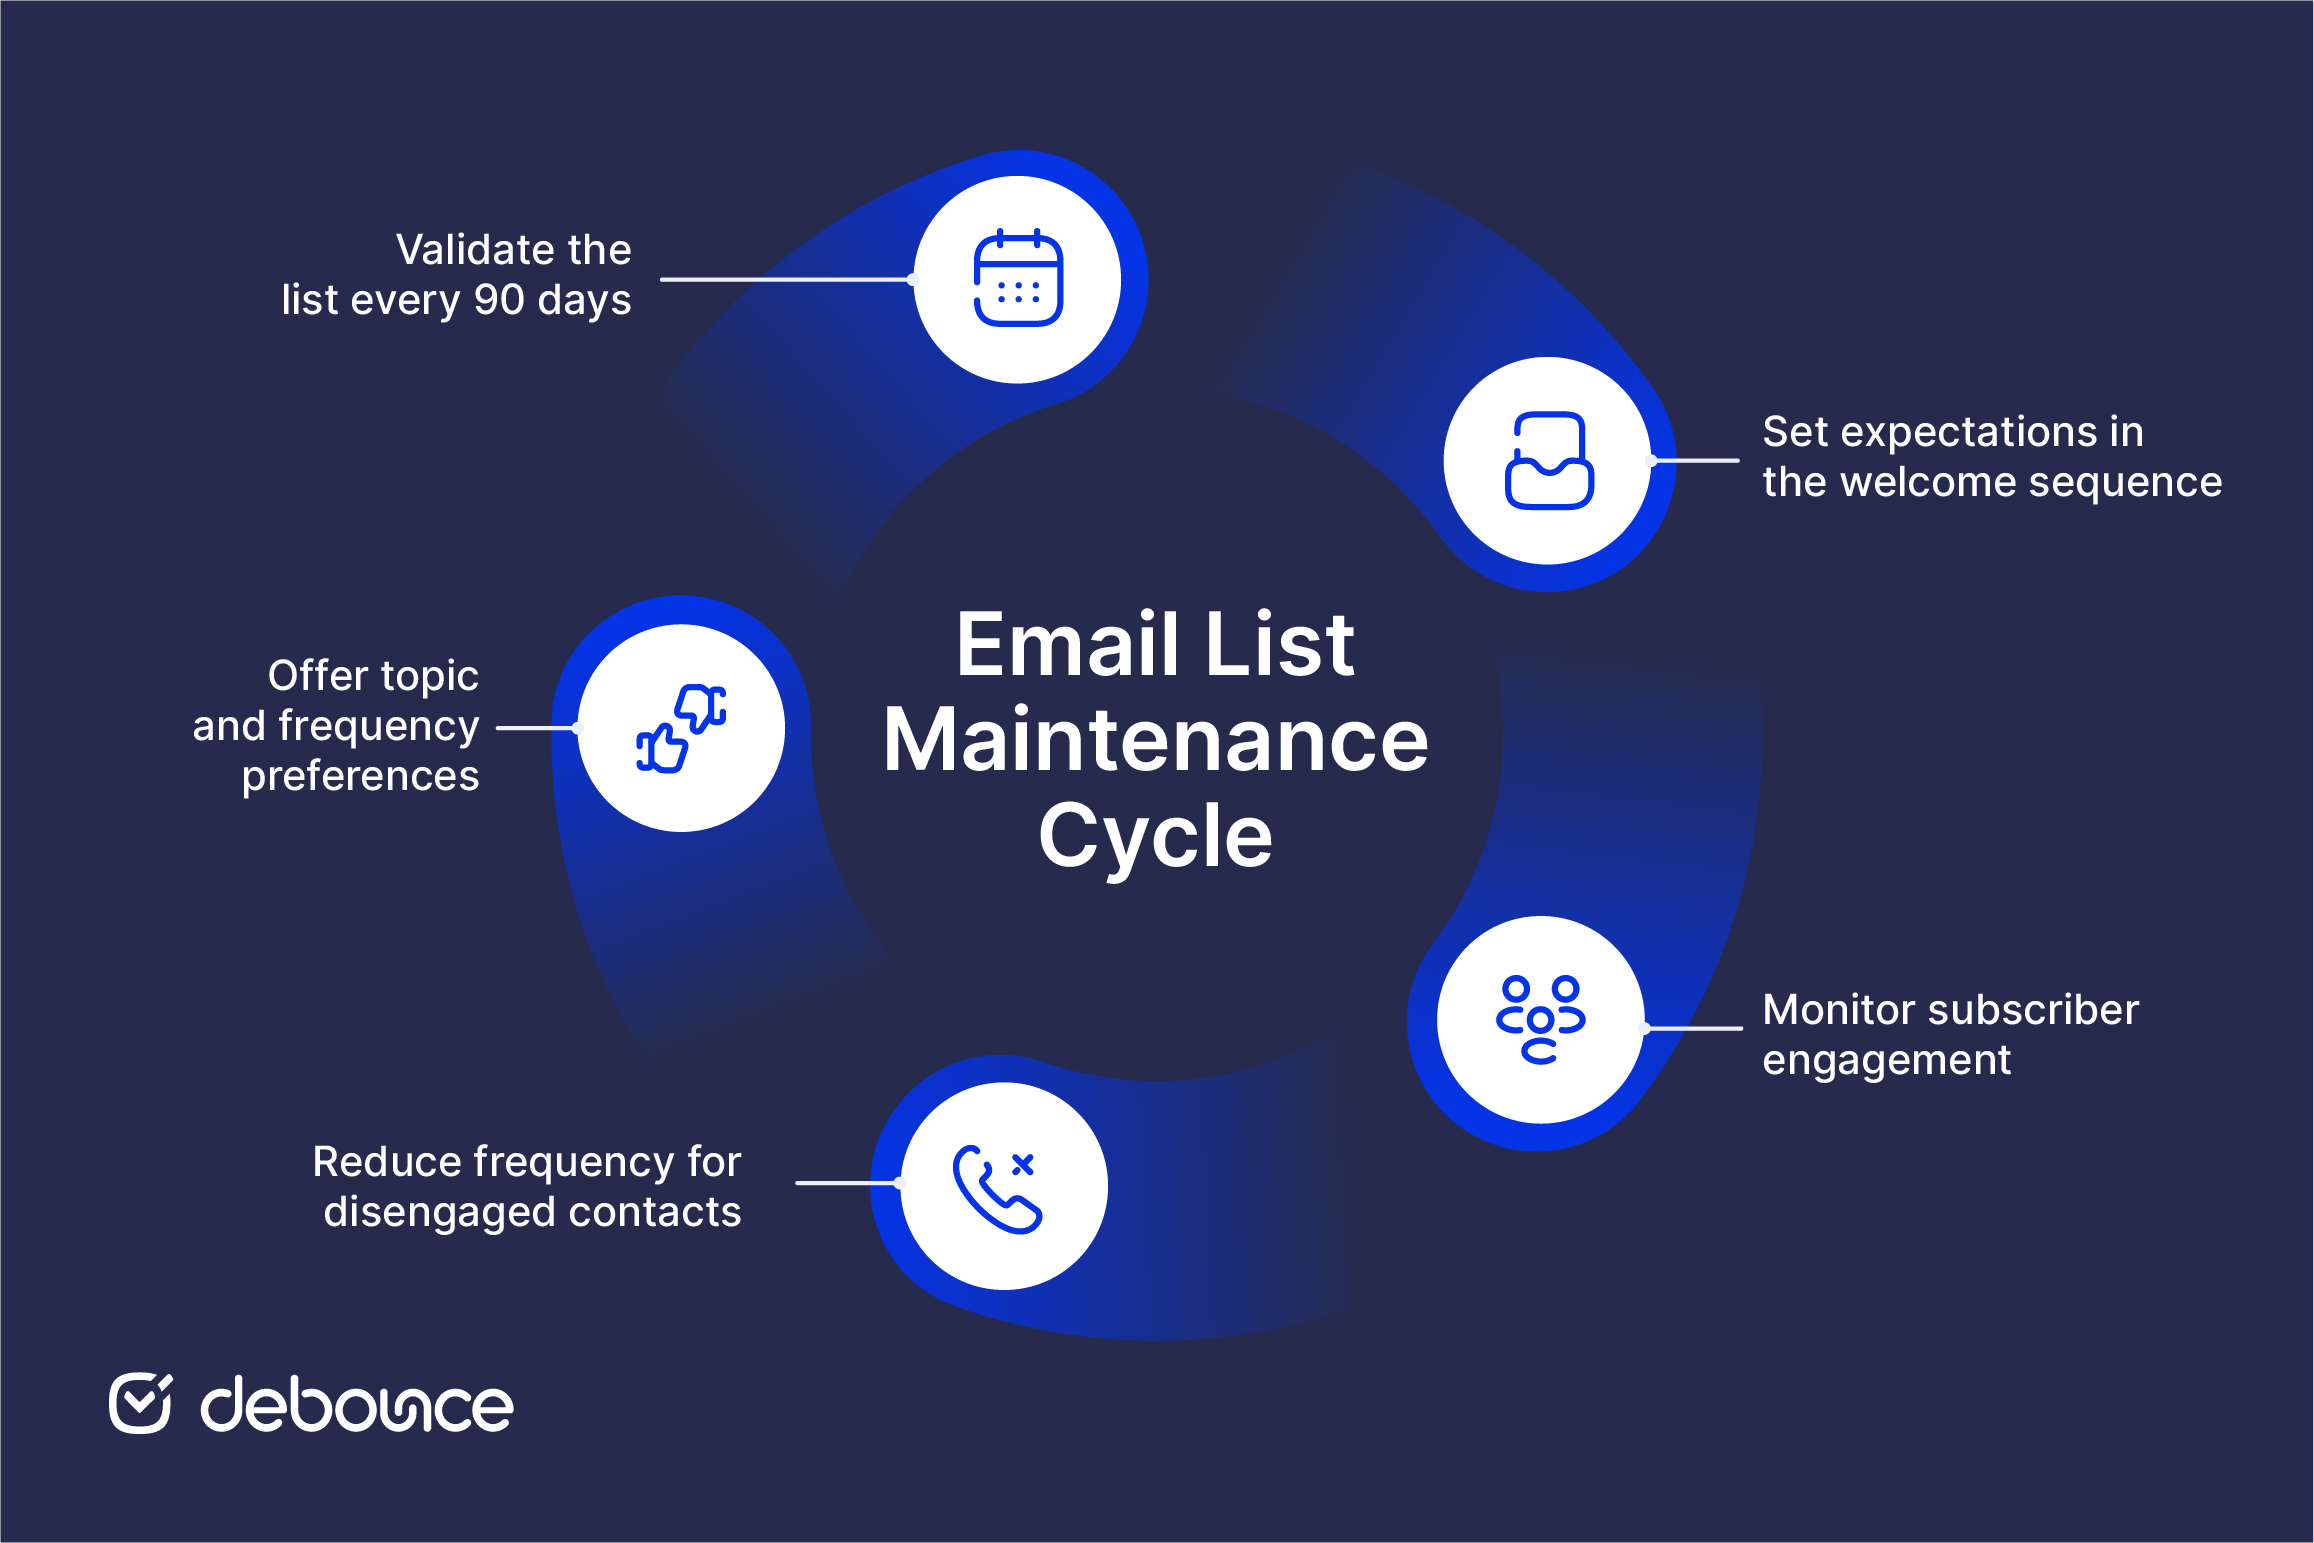
Focus on patterns rather than reacting to every campaign that performs differently. The following signals usually deserve investigation, while several common situations may explain a temporary increase without indicating a broader problem.
Signals worth investigating:
Situations that are not triggers for concern:
A healthy email unsubscribe rate sits below 0.5% per campaign, with under 0.2% indicating a strong, well-aligned list. Above 1% consistently means something structural needs attention: content, frequency, list quality, or a combination of all three.
Unsubscribe rate is only one measure of list health. Read it alongside bounce rate, spam complaints, clicks, and other engagement metrics to understand what’s really happening.
Some unsubscribes are healthy. People who no longer want your emails should be able to leave easily, and a low, consistent opt-out rate is usually a better sign than a list full of inactive subscribers who never engage.
The best long-term protection is a clean, validated list. DeBounce email validation helps remove invalid and undeliverable addresses before they damage deliverability or distort your campaign metrics. Start with 100 free verifications and check your list before your next campaign.
Not necessarily. A true 0% rate across multiple campaigns usually signals a disengaged list where subscribers have stopped paying attention, rather than a list with perfect content fit. If open and click rates are also low, a 0% unsubscribe rate is a warning sign, not a success metric.
Yes. Proactively suppressing or removing subscribers who haven’t opened or clicked in 90+ days is better than waiting for them to unsubscribe, or worse, for them to mark you as spam. Run a re-engagement campaign first, then remove contacts who don’t respond. This keeps your list healthy and protects your sender reputation.
Check it after every campaign, but focus on the trend rather than one result. A three-campaign rolling average makes it easier to spot a sustained increase, especially when your audience is small.
Cold outreach follows different benchmarks because recipients did not actively subscribe to receive your emails. Unsubscribe rates are typically higher than for opt-in marketing lists, but the goal should still be to keep opt-outs as low as possible through relevant targeting and personalized messaging. Reply rate, positive response rate, and booked meetings are generally more useful measures of success, while every cold email should include a clear and easy way to opt out.
Find quick answers to your questions about our pricing and plans.
Accept-all (catch-all) and unknown are not the same as valid. They mean the check could not prove the mailbox is real — treat...

Imagine sending an important email to a client only for it to end up in their spam folder or not reach them at all. Even...

The rejection that comes with recipients unsubscribing is undeniable, but we should not take it personally. Editing and perfecting your messaging do not guarantee total...
Google Postmaster Tools V2 replaces reputation scores with compliance-based evaluation, making authentication and policy alignment the core requirement for inbox placement. The new...
You’ve gathered a list of contacts for your email list. Maybe you’re starting a newsletter, or maybe you’re cold-emailing prospects to gain new clients. Now,...
Email analytics is important. It lets you in on a lot of information about your subscribers and their behavior towards your emails. In this post,...
